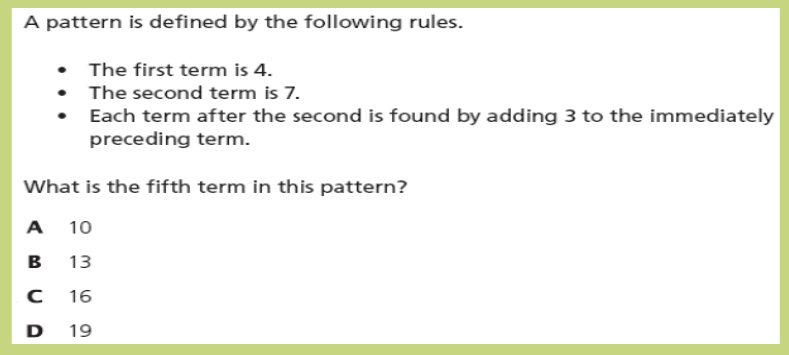
A pattern is defined by the following rules. ∙ The first term is 4. ∙ The second term is 7. ∙ Each term after the second is found by adding 3 to the immediately preceding term. What is the fifth term in this pattern? A pattern is defined by the following rules. ? The first term is 4. ? The second term is 7. ? Each term after the second is found by adding 3 to the immediately preceding term. What is the fifth term in this pattern? advertisement
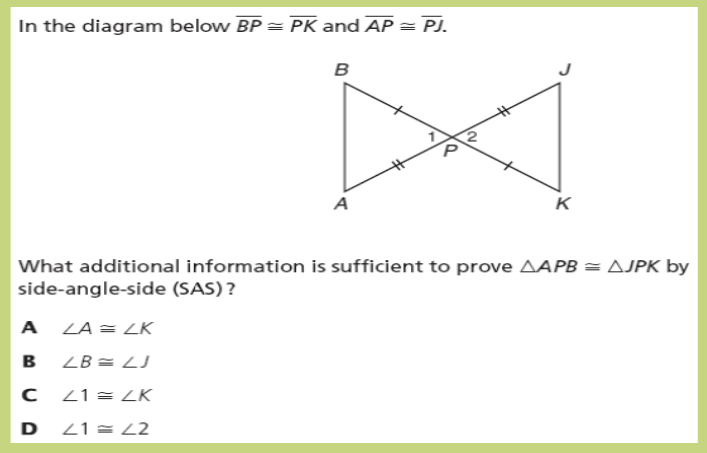
In the diagram below BP ≅ PK and AP ≅ PJ What additional information is sufficient to prove ∆APB ≅ ∆JPK by side-angle-side (SAS)? In the diagram below BP ≅ PK and AP ≅ PJ What additional information is sufficient to prove ∆APB ≅ ∆JPK by side-angle-side (SAS)? advertisement
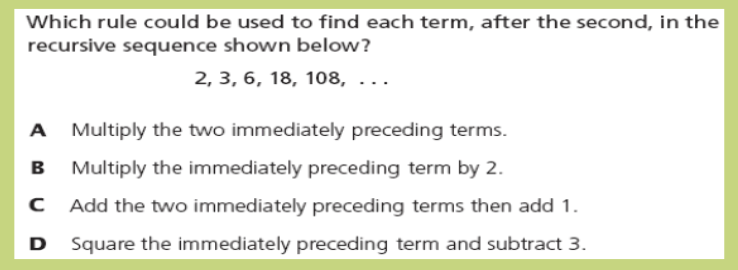
Which rule could be used to find each term, after the second, in the recursive sequence shown below? 2, 3, 6, 18, 108, … Which rule could be used to find each term, after the second, in the recursive sequence shown below? 2, 3, 6, 18, 108, … advertisement
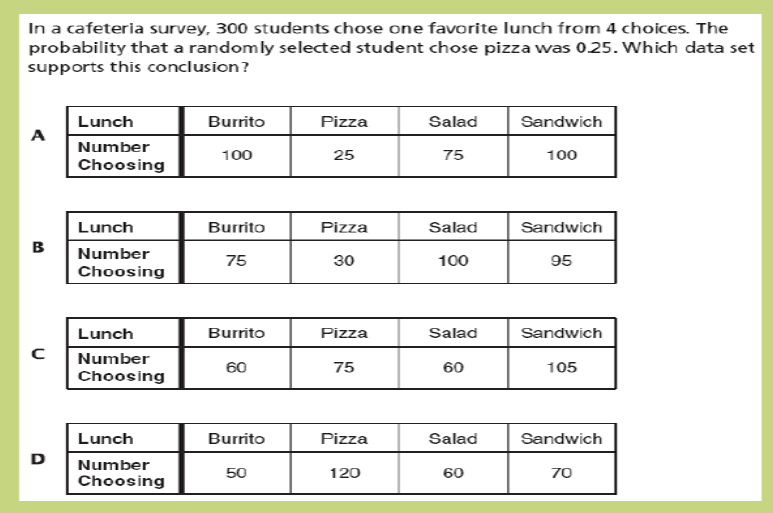
In a cafeteria survey, 300 students chose one favorite lunch from 4 choices. The probability that a randomly selected student chose pizza was 0.25. Which data set supports this conclusion? In a cafeteria survey, 300 students chose one favorite lunch from 4 choices. The probability that a randomly selected student chose pizza was 0.25. Which data set supports this conclusion? advertisement
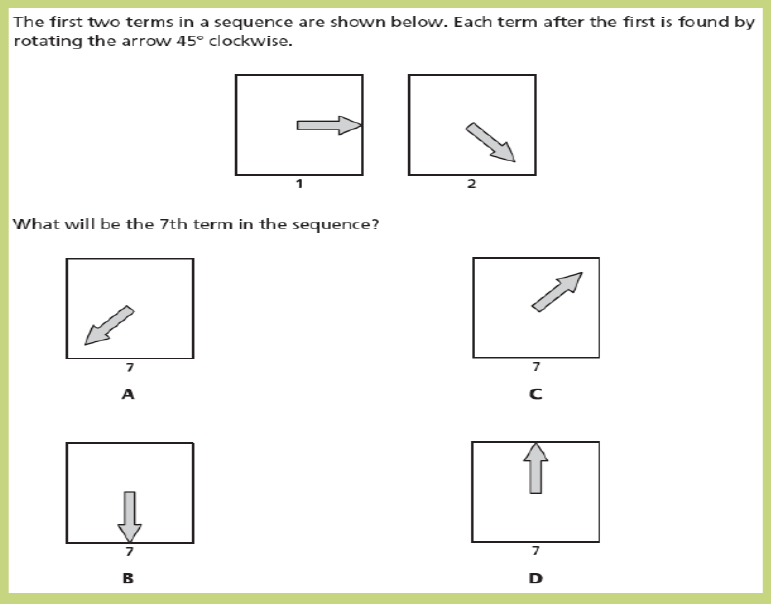
The first two terms in a sequence are shown below. Each term after the first is found by rotating the arrow 45° clockwise. What will be the 7th term in the sequence? The first two terms in a sequence are shown below. Each term after the first is found by rotating the arrow 45
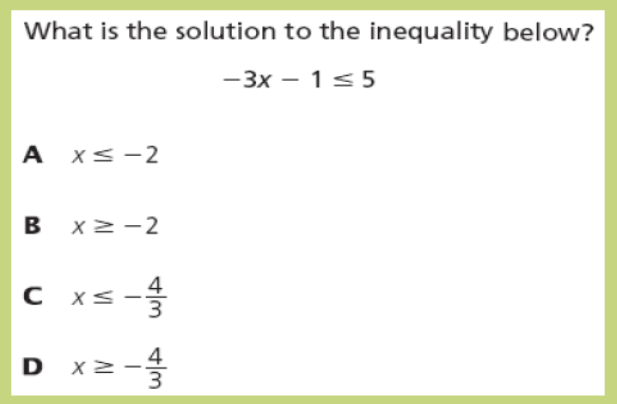
What is the solution to the inequality below? What is the solution to the inequality below? advertisement
If the sum of the measures of two angles is 90°, then the angles are complementary. In triangle ABC, m∠ B= 65°, m∠ C= 90° Which valid conclusion follows directly from the previous statements? If the sum of the measures of two angles is 90°, then the angles are complementary. In triangle ABC, m∠ B= 65°, m∠ C= 90° Which valid conclusion follows directly from the previous statements? advertisement
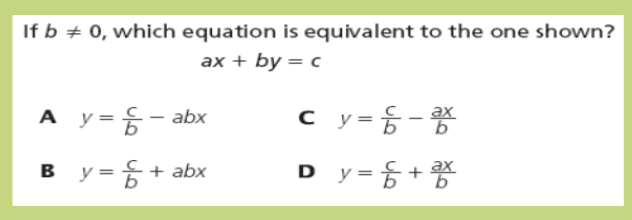
If b ≠ 0, which equation is equivalent to the one shown? ax + by = c If b ≠ 0, which equation is equivalent to the one shown? ax + by = c advertisement
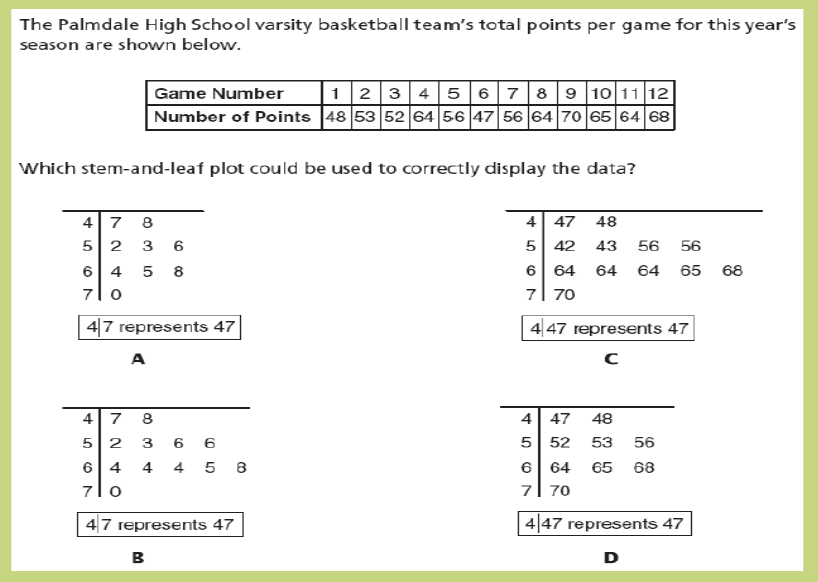
The Palmdale High School varsity basketball team’s total points per game for this year’s season are shown below. Which stem-and-leaf plot could be used to correctly display the data? The Palmdale High School varsity basketball team’s total points per game for this year’s season are shown below. Which stem-and-leaf plot could be used to correctly display the data? advertisement
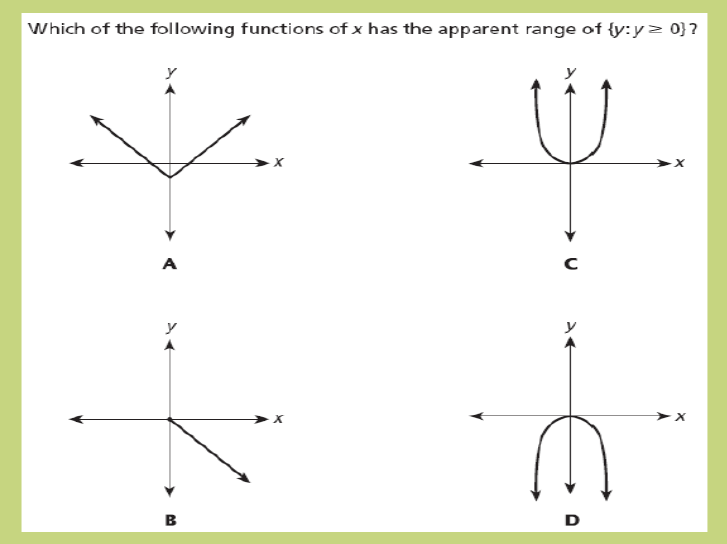
Which of the following functions of x has the apparent range of (y: y >0)? Which of the following functions of x has the apparent range of (y: y >0)? advertisement