Each stem-and-leaf plot shows the number of points scored by a team in basketball tournament. What is the greatest number of points scored by any team in one game? Click to see the stem-and-leaf plot Each stem-and-leaf plot shows the number of points scored by a team in basketball tournament. What is the greatest number of points scored by any team in one game? Click to see the stem-and-leaf plot advertisement
Each stem-and-leaf plot shows the number of points scored by a team in basketball tournament. How many total scores are represented by all stem-and-leaf plots? Click to see the stem-and-leaf plot Each stem-and-leaf plot shows the number of points scored by a team in basketball tournament. How many total scores are represented by all stem-and-leaf plots? Click to see the stem-and-leaf plot advertisement
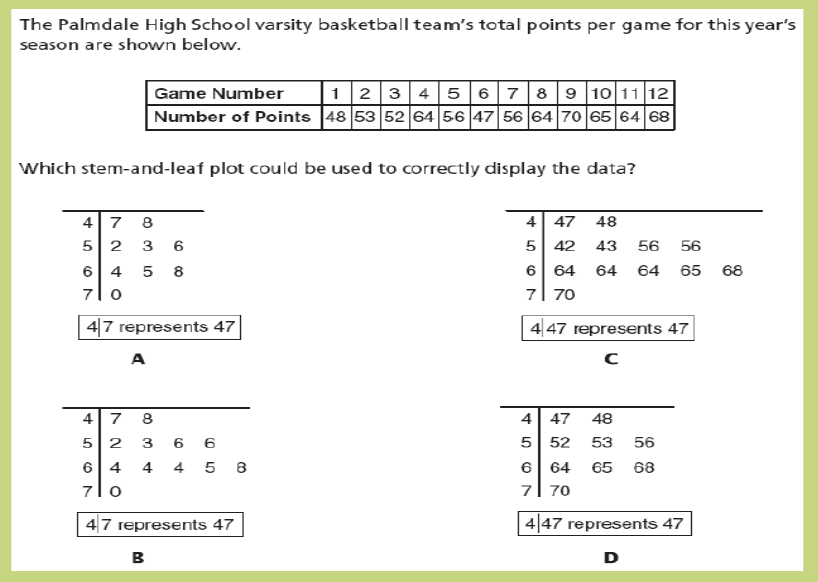
The Palmdale High School varsity basketball team’s total points per game for this year’s season are shown below. Which stem-and-leaf plot could be used to correctly display the data? The Palmdale High School varsity basketball team’s total points per game for this year’s season are shown below. Which stem-and-leaf plot could be used to correctly display the data? advertisement
The stem-and-leaf plot below shows test scores for 25 students. Which box-and-whisker plot correctly displays the data in the stem-and-leaf plot? The stem-and-leaf plot below shows test scores for 25 students. Which box-and-whisker plot correctly displays the data in the stem-and-leaf plot? advertisement
The stem-and-leaf plot represents test scores from two science classes of Mr. Vega and Ms. Watson. Which statement about the data is true? A – The median of Ms. Watson’s scores is less than the median of Mr. Vega’s scores. B – The mode of Ms. Watson’s scores is less than the mode of Mr. Vega’s scores. C – The mean of Mr. Vega’s scores is greater than the mean of Ms. Watson’s scores. D – The range of Mr. Vega’s scores is greater than the range of Ms. Watson’s scores. The stem-and-leaf plot represents test scores from two science classes of Mr. Vega and Ms. Watson. Which statement about the data is true? A – The median of Ms. Watson’s scores is less than the median of Mr. Vega’s scores. B – The mode of Ms. Watson’s scores is less than the mode of Mr. Vega’s scores. C – The mean of Mr. Vega’s scores is greater than the mean of Ms. Watson’s scores. D – The range of Mr. Vega’s scores is greater than the range of Ms. Watson’s scores. advertisement