.


📱 Launch 504 Custom Educational Websites for Just $30/Year
No coding. No hosting. Just results.
Empower your classroom, tutoring service, or educational platform with 200 custom calculators and 304 math exam tutor sites—all hosted and maintained for you. That’s 504 personalized tools for just 6 cents each per year.
✅ Zero technical setup
Just email us what you want updated—we’ll handle the rest.
✅ Instant deployment
Your tools go live fast, optimized for mobile and voice search.
✅ Built for learning
Designed to support memory recall, personalized study, and exam prep.
🎯 Who It’s For
Teachers who want ready-to-use digital tools
Tutors scaling their services without tech overhead
Students needing reliable, on-demand study aids
Anyone who believes learning should be accessible and affordable
Never forget. Always be ready.
With IN-V-BAT-AI, your knowledge lives in the cloud—ready when you are.

IN-V-BAT-AI solution to forgetting! No coding and no website hosting on your part.
Remember on demand is now possible!

Type here Using AI - Voice to Text Then tap SEARCH 2
Signal Sampling Rate
Studied Knowledge About Signal Sampling Rate By: Apolinario "Sam" Ortega, founder of IN-V-BAT-AI
SEL RELAY EVENT REPORT SETTING FOR SAMPLING RATE IS = 4 SAMPLES / CYCLE

Review of Sampling Frequency
Collect 60 sample data points in one second. This is your specified sampling rate. The default time is one second. Written mathematically, 60 data/second.
In electrical engineering analog signal analysis, for example you want to analyze the analog voltage signal, one data point value is usually the calculated square root of mean squared (RMS) over one cycle time interval.
Why RMS value? Because RMS value is a single number value equivalent to any measured waveform (examples of possible waveform: sine wave, square wave, triangular wave, or distorted wave)
in specified time interval to take measurement of the voltage signal. Usually, you need to verify the analog to digital (A/D) conversion sampling rate setting. For discussion purposes
let's use the relay sampling rate setting of 4 sample every cycle. Written mathematically as 4 s/c , where variable letter "s" represents the voltage signal to be sampled and "c"
represent the cycle, the time duration that you are required to take the measurement. This job is not possible to be done manually by human. But man was creative to automate this data acquisition.
Another reason for using RMS value is because when you square a negative number the answer is always positive and it is reflected by the horizontal line above the negative waveform.
In the graph below the RMS constant value of voltage is 12.47 kV which is represented by the horizontal dash line.
Figure 1


| Sum of all voltage square = 1554.293 | To get the mean square divide sum of all voltage square by number of data points 1554.293 / 10 = 155.4293 |
Then get the square root of the mean (rms) = √ 155.4293 = 12.467 rms value is always a constant value over half cycle time interval , represented by the horizontal dash line |
Figure 1. Image created using Desmos graphing
Top of waveform is called Crest and bottom of waveform is called Through

 48 Samples per cycle
 32 Samples per cycle

 24 Samples per cycle
 12 Samples per cycle
 8 Samples per cycle
 6 Samples per cycle
 4 Samples per cycle

WHAT IS THE EQUIVALENT OF 4 SAMPLES / CYCLE TO SAMPLES / SECOND? GIVEN OPERATING FREQUENCY IS 60 Hz.
4 samples /cycle = ? Solve for samples / second
Image not interactive calculator

Compute time interval between data point per second operating in 60 Hz electrical power frequency
|
pulse or data point
second
| = |
pulse or data point
second
time interval between two adjacent data |

![]()
The 4 samples per cycle sampling rate is good enough because 4 samples x 60 cycles is equal to 240 samples per second. The time interval between sampling point is 4 millisecond. It is equivalent to quarter of a cycle.
Most of the high voltage circuit breaker in 500 kV application are rated in 2 cycles which is equivalent to 33.33 millisecond.
SEL RELAY EVENT REPORT OPTIONAL SETTING IS 16 SAMPLES / CYLCE. HOW MANY SAMPLES IN POSITIVE CYCLE AND HOW MANY SAMPLES IN NEGATIVE CYCLE .
GIVEN OPERATING FREQUENCY IS 60 Hz.

WHAT IS THE EQUIVALENT OF 16 SAMPLES / CYCLE TO SAMPLES / SECOND?
GIVEN OPERATING FREQUENCY IS 60 Hz.
Image not interactive calculator

The 16 samples per cycle sampling rate is good for capturing higher resolution event such as temporary over voltage transient due to switching or line to ground fault in a transmission line..
EXERCISES:
A BUSHING MONITOR TECHNICAL SPECIFICATION IS 180,000 SAMPLES / SECOND. WHAT IS THE SAMPLING RATE IN SAMPLES / CYCLE . GIVEN OPERATING FREQUENCY IS 60 Hz.

A PARTIAL DISCHARGE MONITOR TECHNICAL SPECIFICATION IS 1,000,000 SAMPLES / SECOND. WHAT IS THE SAMPLING RATE IN SAMPLES / CYCLE. GIVEN OPERATING FREQUENCY IS 60 Hz.
Image not interactive calculator

Image not interactive calculator

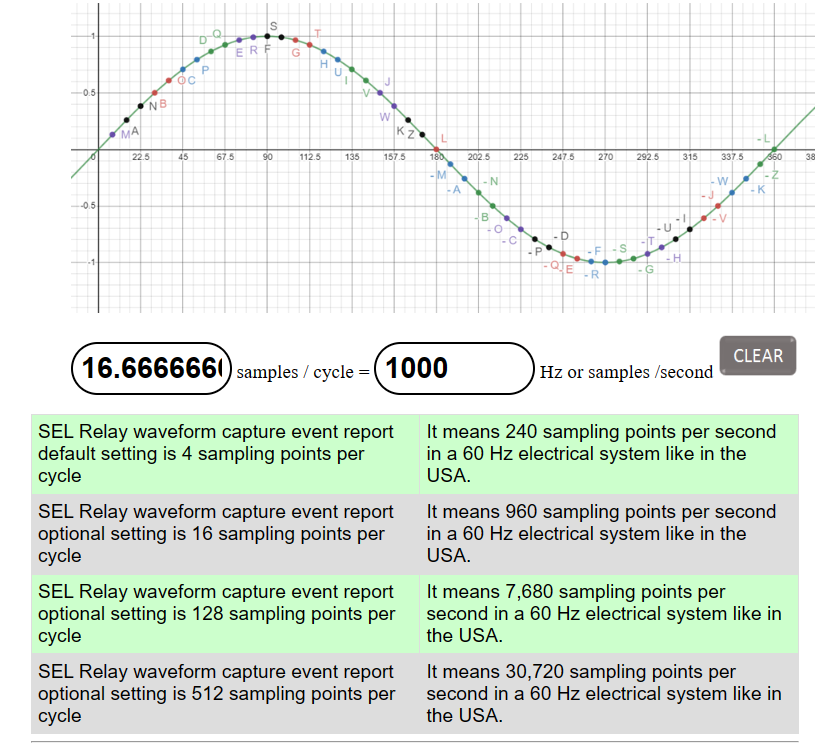
Interactive Calculator
convert samples per cycle to samples per second
convert samples per second to sample per cycle
Assume voltage or current waveform frequency is 60 cycles/second or 60 Hz
(1 sample/cycle ) x ( 60 cycle / second)

samples / cycle operating in 60 Hz electrical system
= samples /second or Hz
![]()
| SEL Relay waveform capture event report default setting is 4 sampling points per cycle | It means 240 sampling points per second in a 60 Hz electrical system like in the USA. |
| SEL Relay waveform capture event report optional setting is 16 sampling points per cycle | It means 960 sampling points per second in a 60 Hz electrical system like in the USA. |
| SEL Relay waveform capture event report optional setting is 128 sampling points per cycle | It means 7,680 sampling points per second in a 60 Hz electrical system like in the USA. |
| SEL Relay waveform capture event report optional setting is 512 sampling points per cycle | It means 30,720 sampling points per second in a 60 Hz electrical system like in the USA. |
| SEL Relay waveform capture event report optional setting is 1024 sampling points per cycle | It means 61,440 sampling points per second in a 60 Hz electrical system like in the USA. |
° degree =
milliseconds
![]()
° degree =
cycle
![]()
Assume voltage or current waveform frequency = 50 cycles/sec or 50 Hz
cycle =
millisecond
![]()
° degree =
millisecond
![]()
° degree =
cycle
![]()
Image not interactive calculator

Image not interactive calculator

Reference frequency is 100,000 Hz or 100 kHz
cycle =
microsecond
10 microsecond = 10µsec = 10 x 10-6 second =10 e-6 second = 0.000010 sec
![]()
Image not interactive calculator
Image not interactive calculator

Reference frequency is 50 MHz
cycle =
nanosecond
20 nanosecond = 20 nsec = 20 x 10-9 second =20 e-9 second = 0.000000020 sec
![]()
For 60 Hz
1 cycle * sec /60 cycles = 0.0166667 seconds = 16.667 milliseconds
360 electrical degree = 1 cycle
1 ° degree = 1/360 cycle = 0.002778 cycle
For 50 Hz
1 cycle * sec /50 cycles = 0.02 seconds = 20 milliseconds
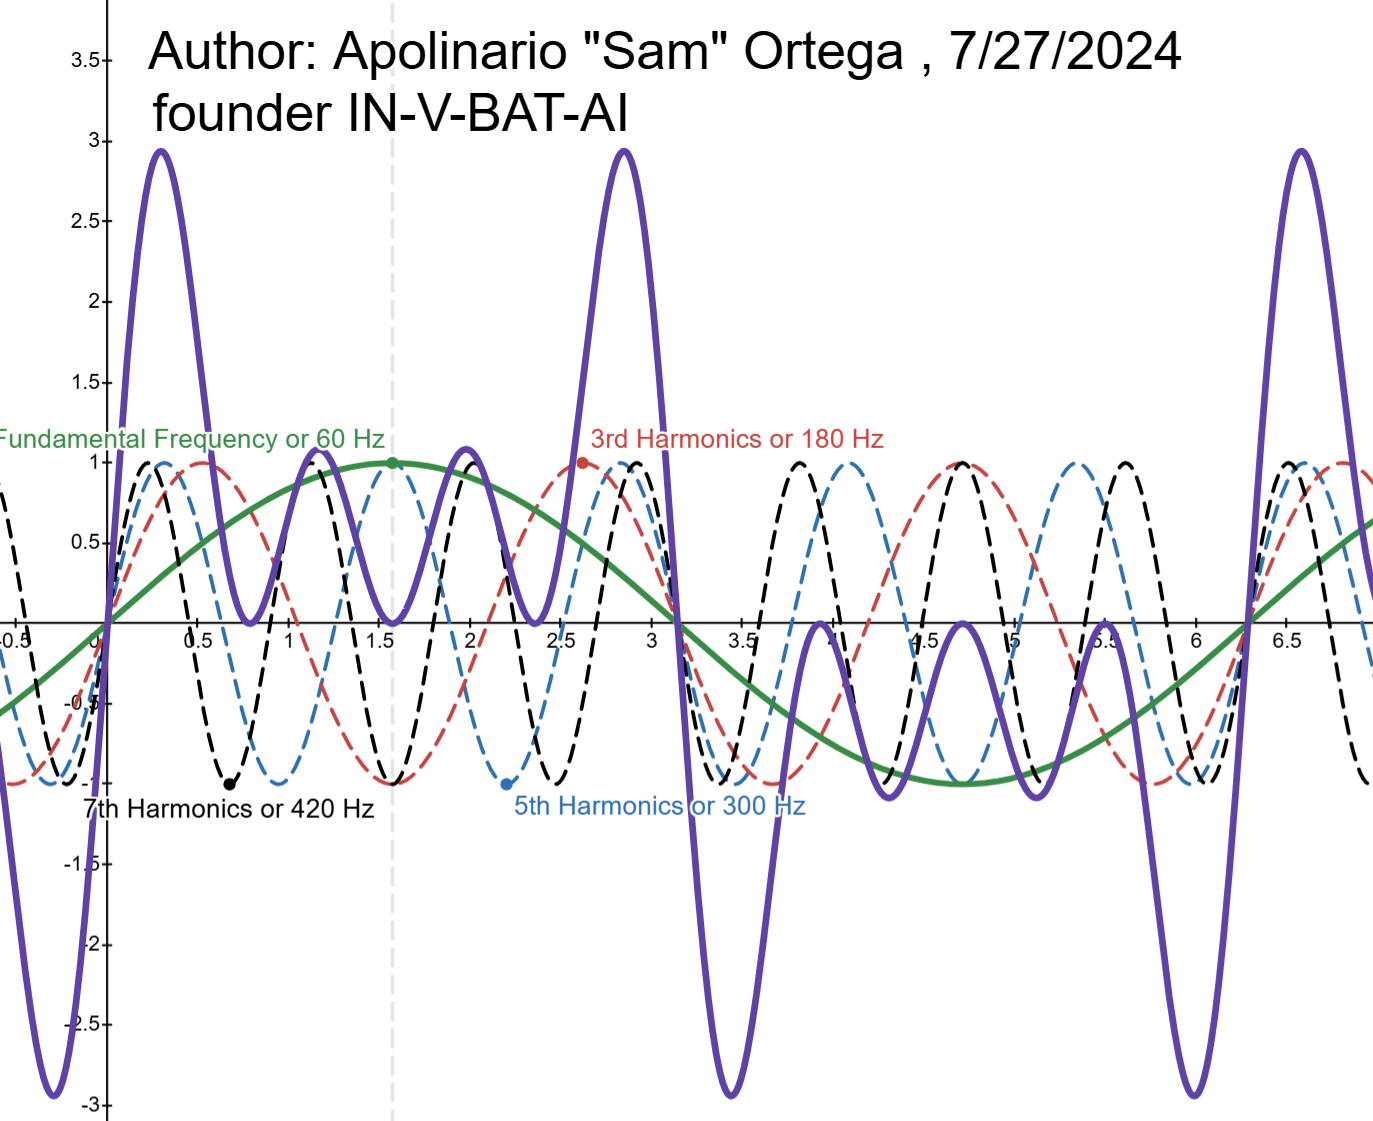
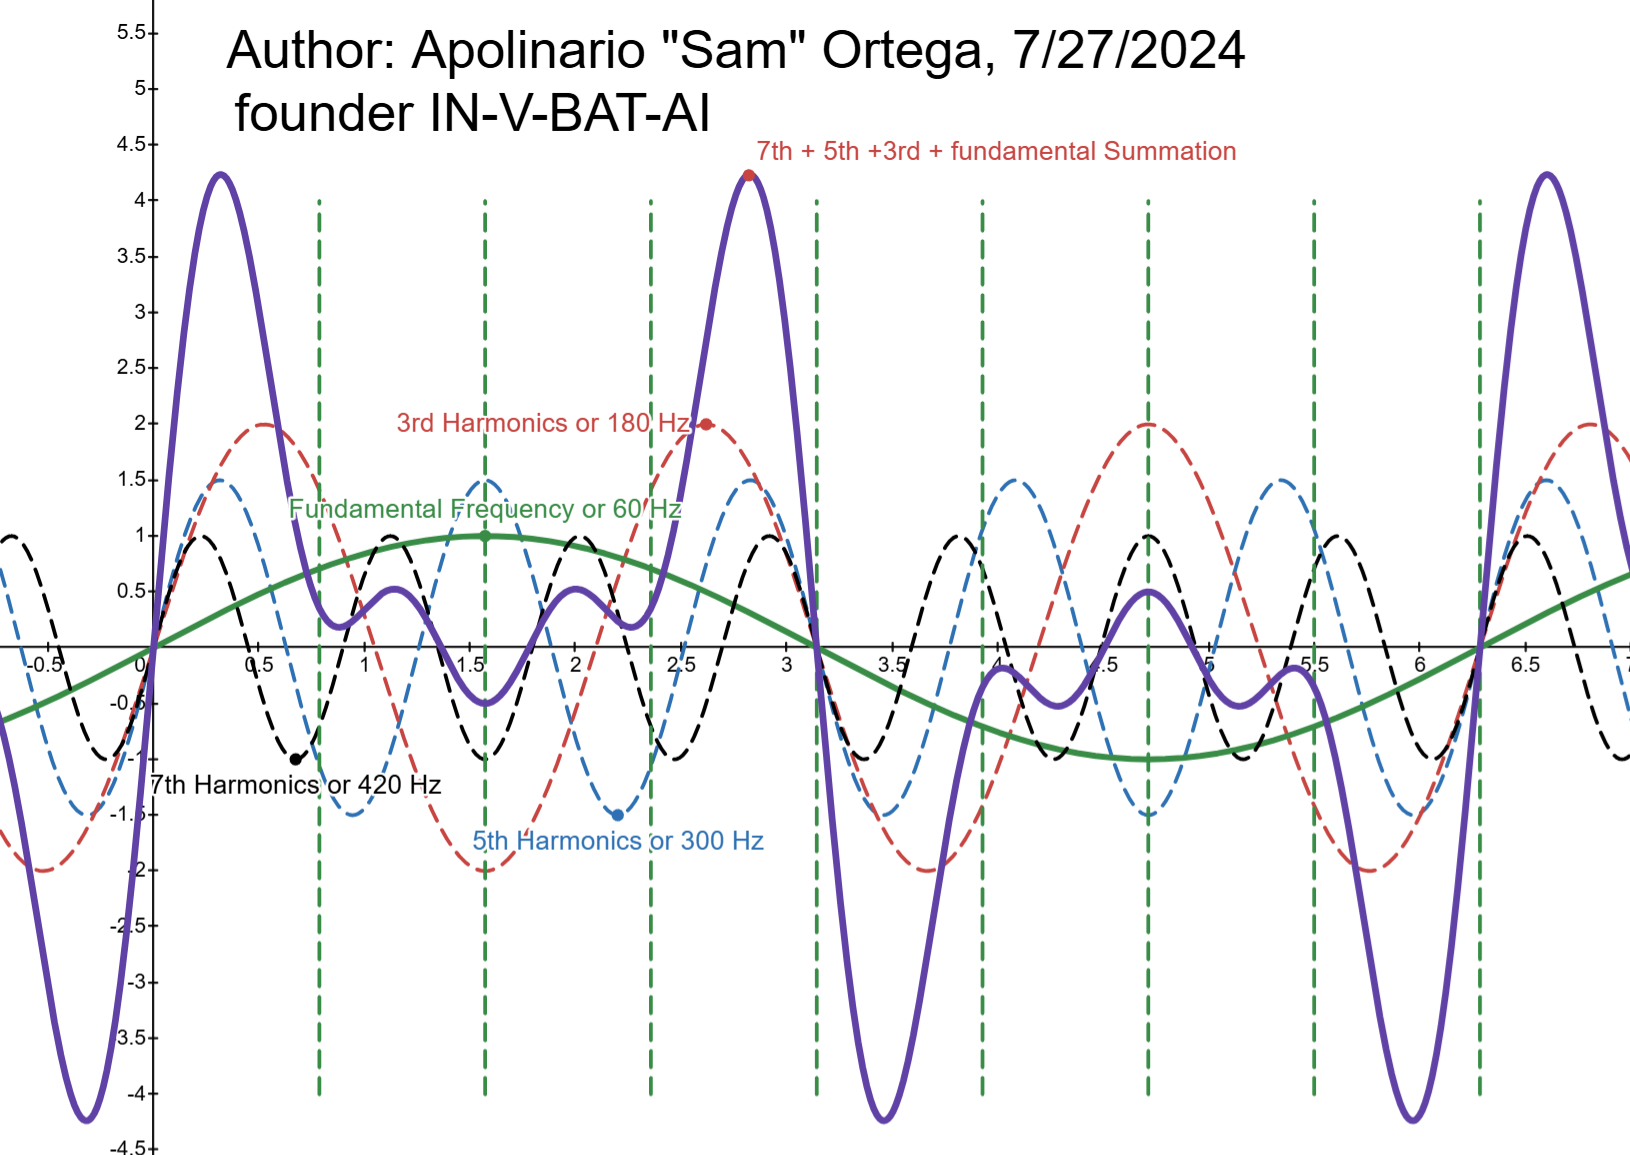
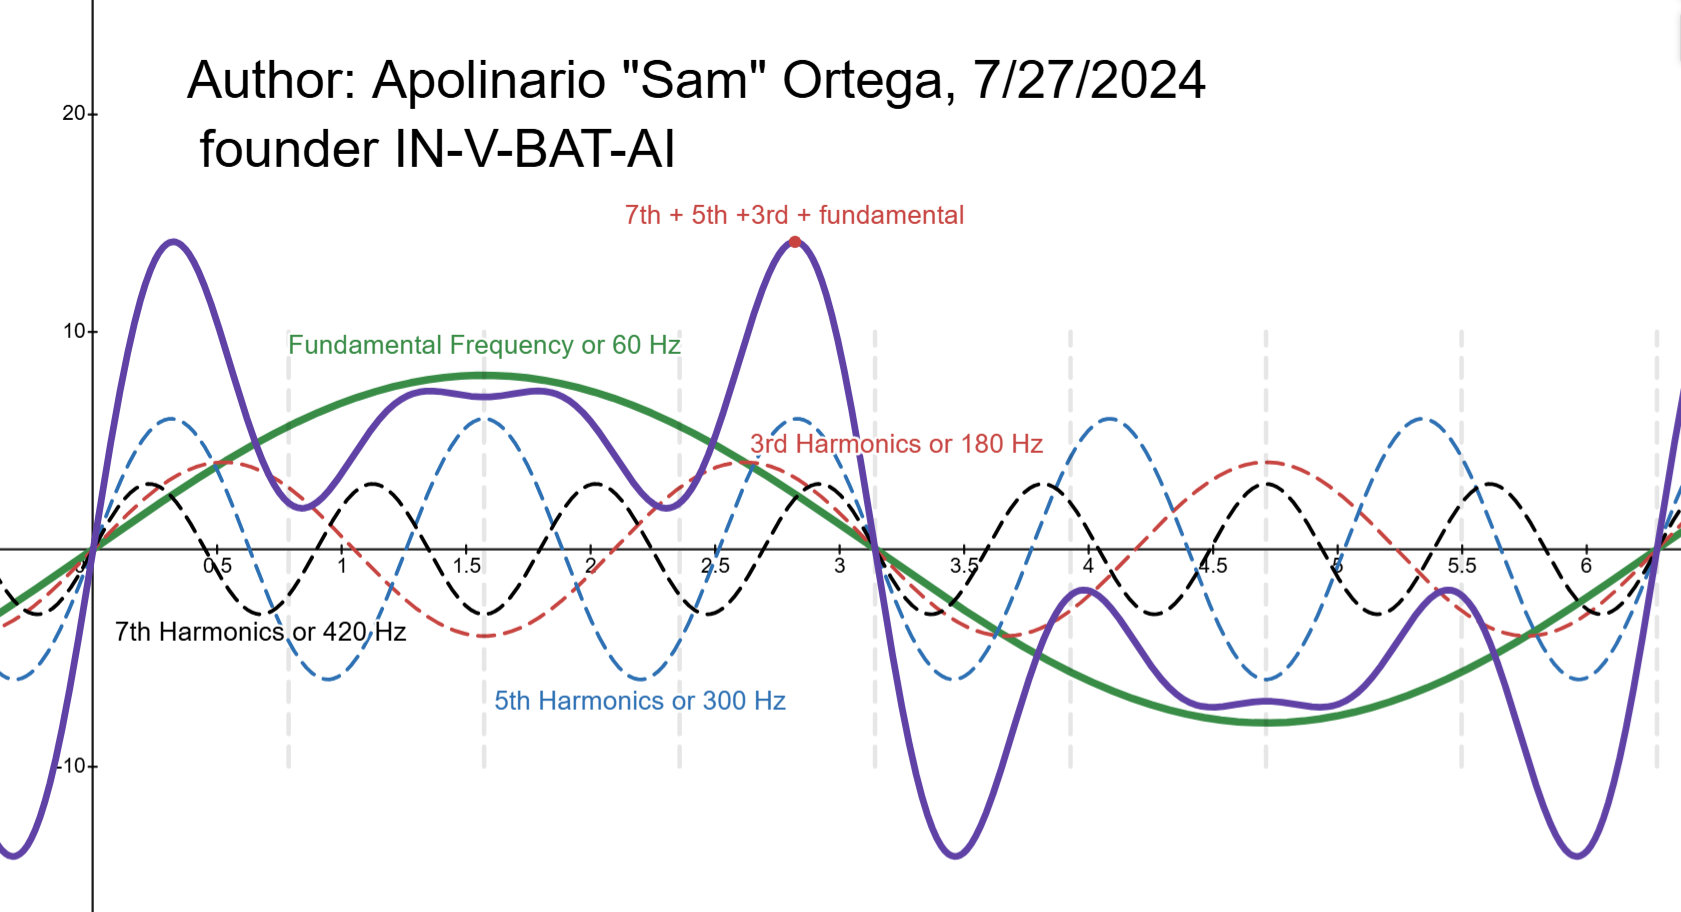
Review of Harmonics
Sampling Frequency Reviewer
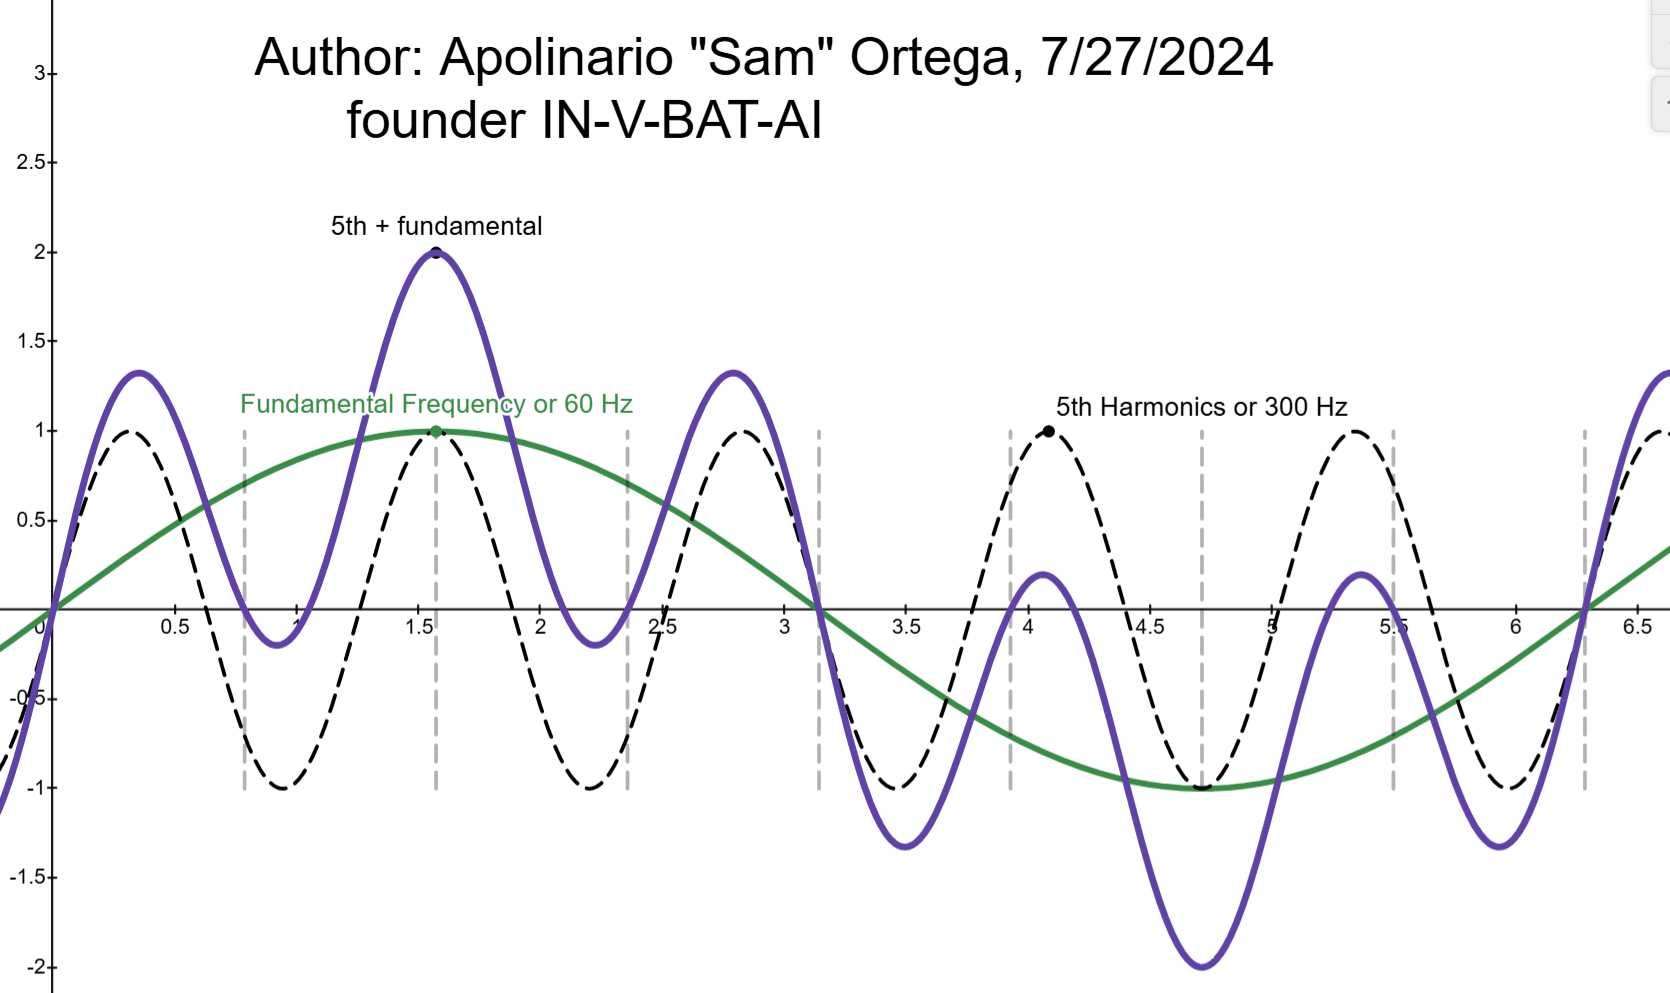
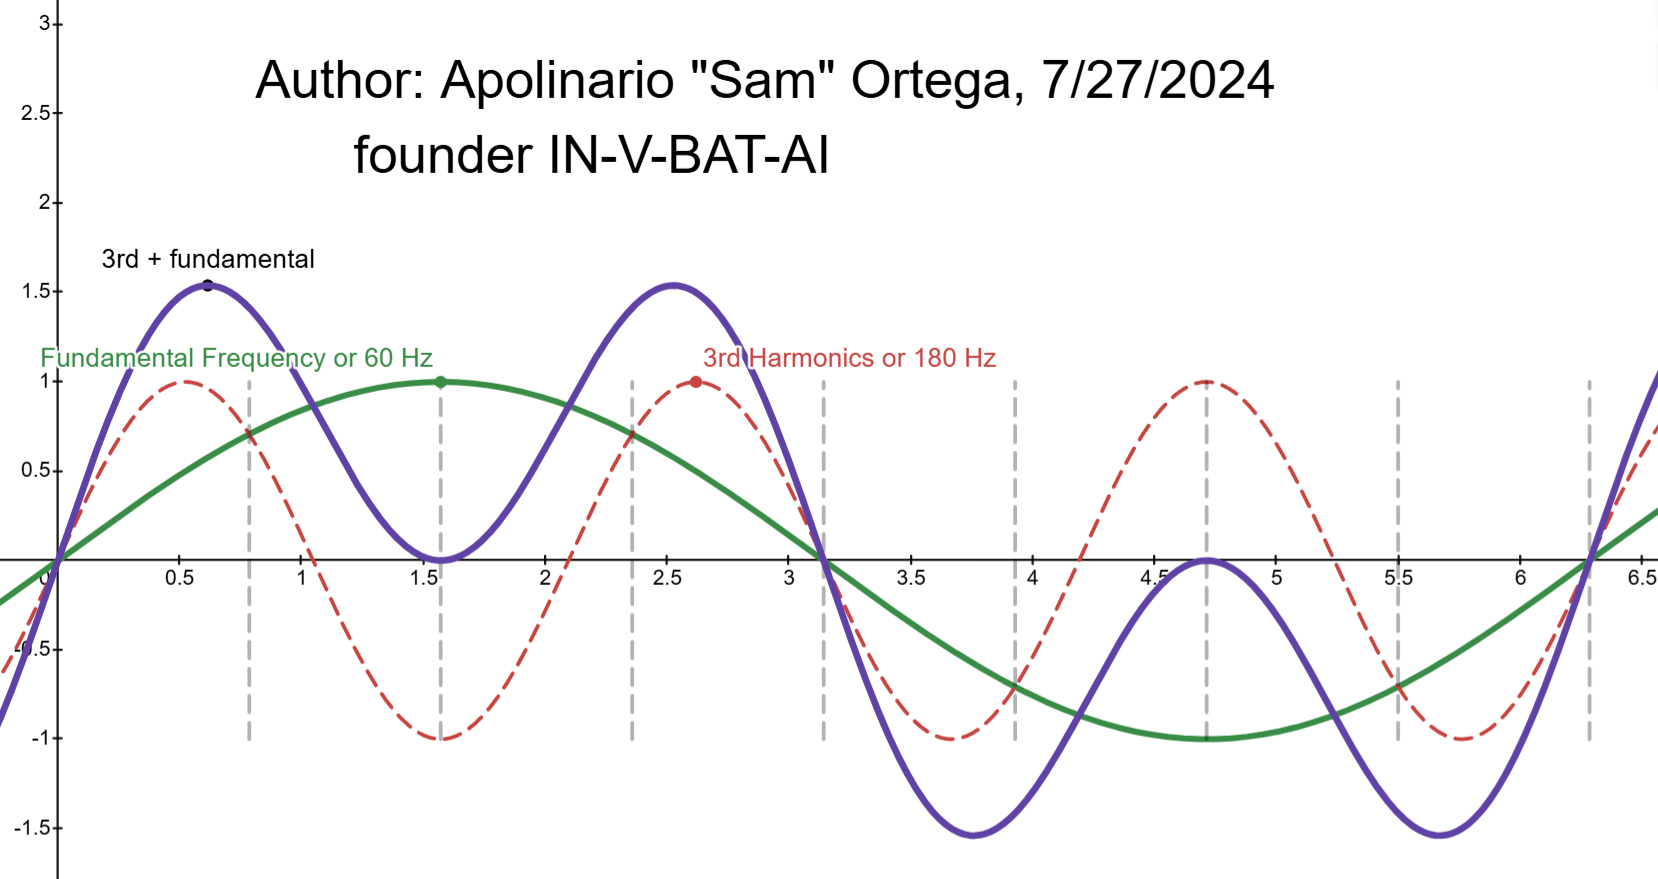
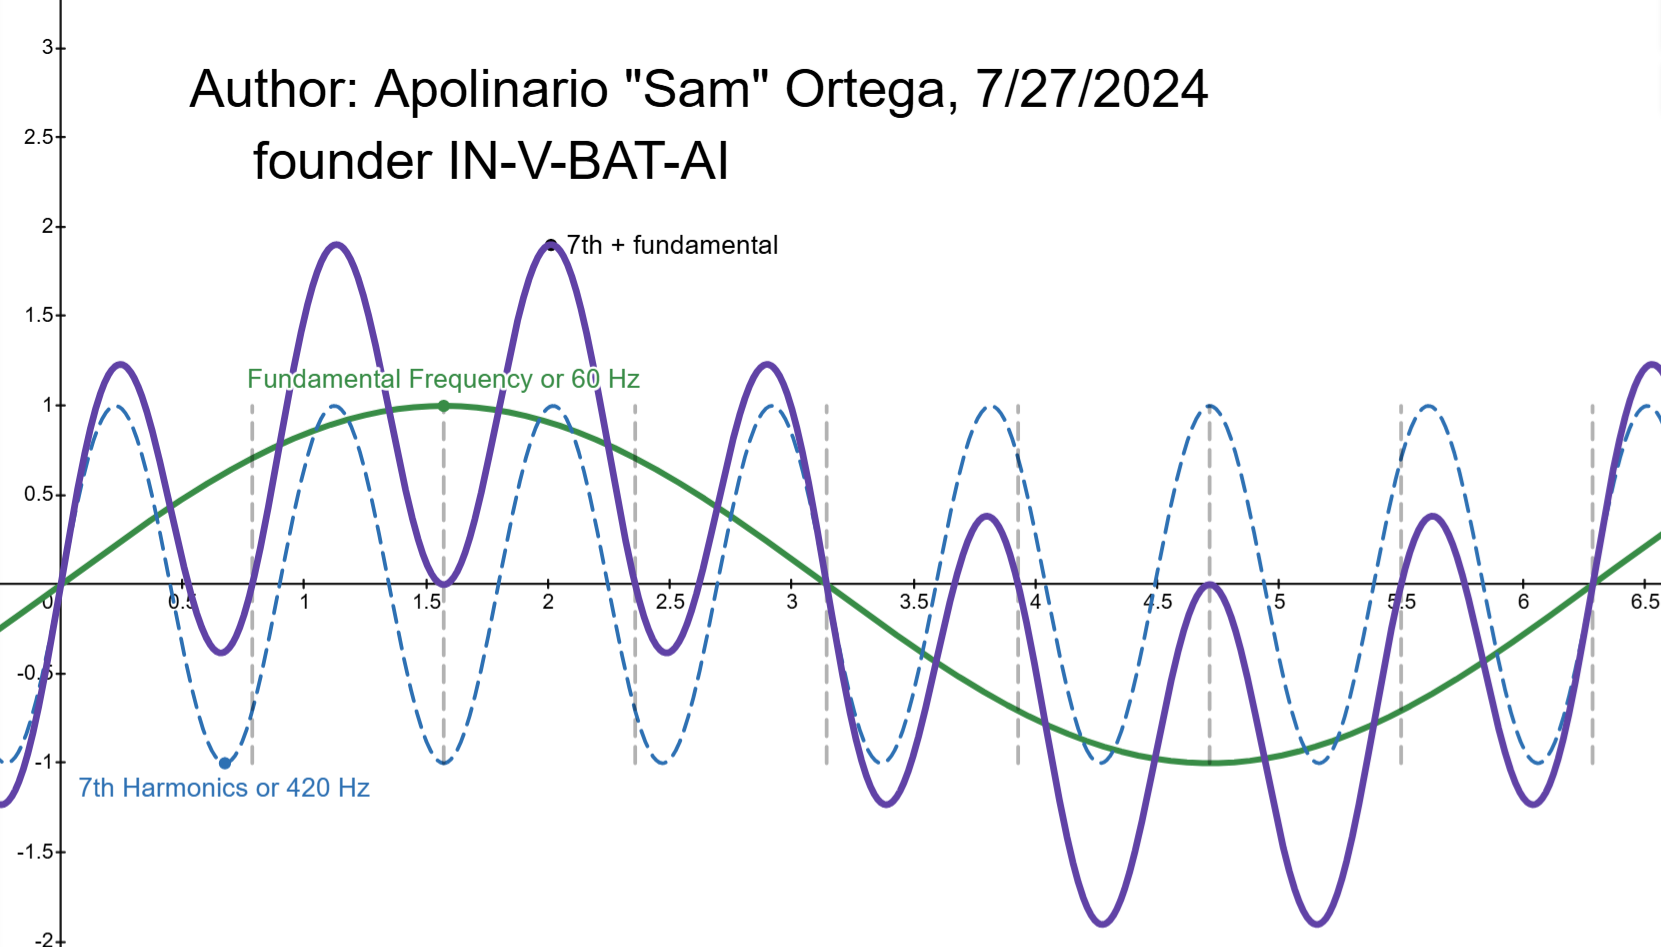
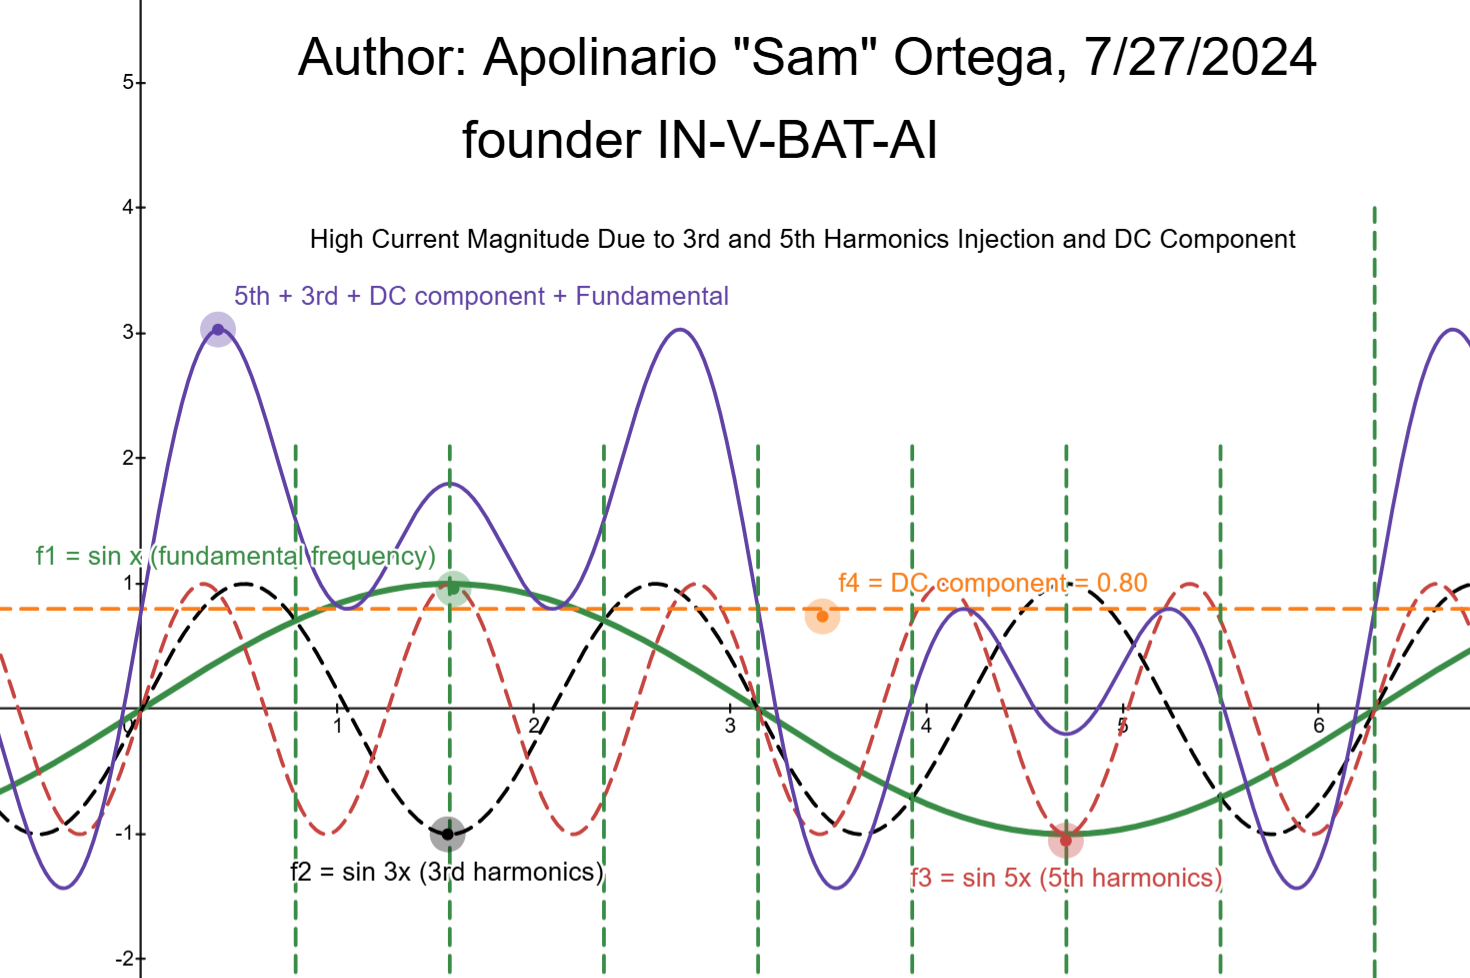
 3rd + 5th + 7th Harmonic Addition to Fundamental

Electro Magnetic Transient Program Simulation Waveform (EMTP) shared in LinkedIn by Bahram Khodabakhchian
Given the distorted waveform from EMTP study how can we do fast fourier transform (fft) to discover the dominant frequency of voltage or current?
We comply with LinkedIn Embed Term of Use
Fast Fourier Transform shared in LinkedIn by: Source Credit to:
Bingsen Wang, PhD
Global Manager, HV Safety Integration at Stellantis, SMIEEE
We comply with LinkedIn Embed Term of Use
.
IN-V-BAT-AI helps you to remember on demand even if your memory recall is block by too much worries of daily life. It helps you to organize knowledge in ways that facilitate retrieval and easy to use immediately.
Source: How People Learn II: Learners, Contexts, and Cultures
.
How can IN-V-BAT-AI be used in classrooms ?
The IN-V-BAT-AI solution can be a valuable tool in classrooms, enhancing both teaching and learning experience. Here are some ways it can be utilized:
⋆ Personalized Learning : By storing and retrieving knowledge in the cloud, students can access tailored resources and revisit
concepts they struggle with, ensuring a more individualized learning journey.
⋆ Memory Support : The tool helps students recall information even when stress or distractions hinder their memory, making it
easier to retain and apply knowledge during homework assignments or projects.
⋆ Bridging Learning Gaps : It addresses learning loss by providing consistent access to educational materials, ensuring that
students who miss lessons can catch up effectively.
⋆ Teacher Assistance : Educators can use the tool to provide targeted interventions to support learning.
⋆ Stress Reduction : By alleviating the pressure of memorization, students can focus on understanding and applying concepts,
fostering a deeper engagement with the material.
.


.
.
Try AI website hosting
$30 per year
| Year | Top 10 countries | Pages visited |
| 2023 | 1. USA 2. Great Britain 3. Germany 4. Canada 5. Iran 6. Netherlands 7. India 8. China 9. Australia 10. Philippines | 127,256 Pages / 27,541 Visitors |
| 2024 | 1. USA 2. China 3. Canada 4. Poland 5. India 6. Philippines 7. Great Britain 8. Australia 9. Indonesia 10. Russia | 164,130 Pages / 40,724 Visitors |
| Daily Site Visitor Ranking 8/3/2025 | 1. USA 2. China 3. India 4.Iran 5. Latvia 6. Russia 7. Canada 8. Lithuania 9. Poland 10. Great Britain | Year to Date 120,517 Pages / 35,456 Visitors |
Data source: Advanced Web Statistics 7.8