





What did you learn today that you want to remember on demand using your smartphone and tablet
NO MORE LEARNING LOSS ?
Null Hypothesis and t-Test Statistics
How to understand the null hypothesis testing in randomly controlled trial experiment
In hypothesis testing literature null hypothesis is often designated by variable letter H0 read as H naught.
Null hypothesis means there is zero or null relationship/no difference/no effect that exist between the implemented program intervention method and the existing business as usual method. For example, assume your state is Arizona (AZ). You want to run a randomly controlled trial to validate your hypothesis that your proposed intervention program method will improve the mathematics test score of 4th grader in your class when compared to NAEP 2022 published test score which is 232.

In order to do that you will need to produce evidence to prove your hypothesis is valid or reasonable. Then you will set up controlled group of 4th grade students that do not use your proposed intervention program method. This is the business as usual or do the existing mathematics teaching program for 4th grader. Then you will set up intervention group of 4th grade students that will use your proposed intervention program method.
The null hypothesis is initially assumed to be true in hypothesis testing unless there is significant evidence to reject the initial hypothesis. In this case the null hypothesis is saying there is no relationship/no difference/no effect/no improvement the implemented intervention program when compared to your published 2022 STATE NAEP 4th grader average score. In order to do the comparison, you will need to use sample previous test questions from NAEP 4th grader mathematics test database. This test questions will be used as a baseline or reference for pre-test to collect the statistical mean value of controlled group μ1 (mean 1 score for controlled group) For example for controlled group of twenty (20) 4th grader students you administered pre-test exam using previous NAEP test questions for 4th grader. Then using NAEP automatic scaling score you will record the corresponding scale score of 20 students. let's assume your controlled group of twenty (20) students their statistical pre-test mean value is = 232 exactly the same with your state average NAEP scale score. Therefore controlled group pre-test mean 1 value, μ1 = 232. You do the same for your intervention group of students and you computed their pre-test mean 2 value, μ2 = 232.
The null hypothesis states that after implementing the proposed intervention program the statistical computed mean score of controlled groups of students (do not received intervention instruction) and the statistical computed mean score of intervention group of students has zero or null difference meaning no effect, no improvement in test score. To prove that there is no difference between control group of students and intervention group of students.
| Intervention group of students computed mean score, MEAN 2 = | 232 |
| Controlled group of students computed mean score MEAN 1 = | 232 |
| The difference MEAN 2 minus MEAN 1 = | 232 - 232 = 0 (zero or null) no effect, no improvement |
The zero is also called null. Hence, it is known as Null Hypothesis. Null Hypothesis is the initial assume true statement unless proven by evidence that there is a significant test score improvement after implementing the intervention instruction.
Written mathematically as
H0 : μ1 (mean 1 score of controlled students) = μ2 (mean 2 score of intervention students)
H0 : μ2 (MEAN 2) - μ1 (MEAN 1) = 0 The intervention program has no difference/no effect/no relationship to test score improvement. Here the initial hypothesis that there is no evidence or zero improvement in test score, the null hypothesis is retained.
After post - test , you computed again mean score of controlled and intervention students.
Here mean score μ1 = μ2 are the known population under investigation for example the population of 4th grader in the whole United States. Since it is impractical and expensive to collect all the mean score of known population under investigation. Researcher usually agree to a reasonable sample size mean to approximate the true behavior of the known population.
Let x1 as our controlled group sample mean 1 score
Let x2 as our intervention group sample mean 2 score
H0 : μ1 = 50% (μ1 mean score =50%) = μ2 =50% (μ2 mean score =50%)
H0 : x1 = 64.2% (x1 mean score =64.2%) and x2=63.45% ( x2 mean score =63.45%)
H0 : μ1 = μ2 or x1 = x2The intervention program has no difference/ no effect/no relationship. Here the null hypothesis is retained.
If the null hypothesis is not true or not valid. It means the intervention group got a higher mean score compared to controlled group of students. Therefore there is an alternative hypothesis, written mathematically as Ha or H1
Ha or H1: μ2 > μ1 The intervention program has evidence of difference / has evidence of effect / has evidence of relationship. So, the alternative hypothesis using limited sample of population appears to be a good alternative.
Ha or H1: μ2 - μ1 > 0 The intervention program has evidence of difference / has evidence of effect / has evidence of relationship. So, the alternative hypothesis using limited sample of population appears to be a good alternative to improve students mathematics test score outcome with respect to limited sample from NAEP previous test database.
I will try to explain in my own understanding the null hypothesis, meaning the implemented intervention program has no difference/no effect/no relationship to test score improvement.
The post test score of intervention students are shown below. The researcher usually makes a decision what is the acceptable significant evidence to prove that the intervention program is working. This significant evidence is captured by the alpha value, α . The common alpha value use by industry researcher is α = 0.05. What does 0.05 means? Why it is used by NAEP p < 0.05 as significant evidence? To answer this question, you must understand what is the letter variable "p" means? The letter variable "p" is the placeholder variable for computed probability of student that did not improve. So, how do you calculate the probability of student that did not improve = 0.05? or p = 0.05. Answer 1 / 20 = 0.05. With fraction it is easy to explain the meaning of p=0.05. It means 1 out of 20 students did not improve their test score even after taking the intervention instruction. But the 19 out of 20 students improve their test score. Wow 19 out of 20 students improve their test score, you will conclude that is significant enough.
It means 1 student out of 20 students DID NOT improve his/her test score after taking the intervention instruction. It means 1 out of 20 students has zero effect or no difference to improve his test score or null effect even after using the intervention instruction. But the remaining 19 students out of 20 have clear evidence that they improve their test score. The α = 0.05 significant value means 19 out 20 students improve their average test score compared to the baseline reference average test score.
So every time you see this probability expression, it is telling you that only 1 student DID NOT improve his test score but the remaining 19 students out of 20 students did improve their test score.
Probability of no effect (p) < = α What is the definition of this mathematical expression you often see in hypothesis testing? it means if the computed probability of no effect, p, is less than or equal to the specified significant evidence value, alpha α = 0.05 or 5% is true then the logical conclusion is to reject the null hypothesis . Because there is a significant difference/ significant relationship/ significant effect the intervention program to student's test score improvement. if p > α is true then the logical conclusion is fail to reject the null hypothesis and the evidence of student test score improvement is insufficient.
If the mathematical expression 90% (p) > (α) 5% is true, then the logical conclusion is fail to reject the null hypothesis and the evidence of student test score improvement is insufficient.
| Student ID | Post Test Score | Score greater than reference mean score of 232 (Yes/No) | Assign 1 for No, no effect is true and assigned 0 for Yes, no effect is false because there is improvement |
| 1 | 236 | Yes | 0 |
| 2 | 237 | Yes | 0 |
| 3 | 238 | Yes | 0 |
| 4 | 200 | No | 1 |
| 5 | 233 | Yes | 0 |
| 6 | 237 | Yes | 0 |
| 7 | 233 | Yes | 0 |
| 8 | 234 | Yes | 0 |
| 9 | 239 | Yes | 0 |
| 10 | 240 | Yes | 0 |
| 11 | 236 | Yes | 0 |
| 12 | 233 | Yes | 0 |
| 13 | 235 | Yes | 0 |
| 14 | 236 | Yes | 0 |
| 15 | 238 | Yes | 0 |
| 16 | 239 | Yes | 0 |
| 17 | 240 | Yes | 0 |
| 18 | 237 | Yes | 0 |
| 19 | 234 | Yes | 0 |
| 20 | 236 | Yes | 0 |
Now you understand the meaning of p < 0.05. It means 1 student out of 20 did not improve their test score even after taking intervention instruction that was demonstrated by evidence as significantly effective for improving test score. So what does it mean? It means for AZ 4th graders with total enrollment of 80,780 in FY21, if AZ Department of Education implemented a significantly effective intervention instruction there would be evidence that 80,780 x 0.05 = 4,039 students will not improve their test score, but 76,471 students will improve their test score. That is WOW, a significant improvement.
| 2021 | 3rd Grade Students | 4th Grade Students | 5th Grade Students | 6th Grade Students | 7th Grade Students | 8th Grade Students | 9th Grade Students | 10th Grade Students | 11th Grade Students | 12th Grade Students |
| Arizona | 80,280 | 80,780 | 82,159 | 86047 | 90,474 | 90,812 | 90,826 | 88,938 | 83,764 | 90,704 |
Visit statistic and probability calculator
How to compute the p-value using t-distribution table
Here it appears that School A has a significant improvement because only one student did not improve. But statistics has a standard practice of computing probabilities associated with null hypothesis designated by p-value. Upon application of statistical computation, it turns out that School A did not improve significantly. But if you review the detailed test score, you could argue that 19 out of 20 students improve their test score compared to state average score seems significant enough. According to NAEP scaling score AZ students from School A is above basic mathematics and below proficient in their mathematics skills.


Here School B has a significant improvement many students exceeded the state average test score but some has test score equivalent to the state score. But how significant is improvement? The statistics has a standard practice of computing probabilities associated with null hypothesis designated by p-value. Upon application of statistical computation, it turns out that School B did a p value of 0.0000, an increase of 12 points compared to state average score of 232. According to NAEP scaling score AZ students from School B is very close to proficient in their mathematics skills.
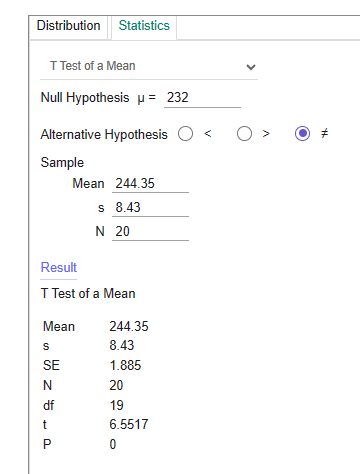
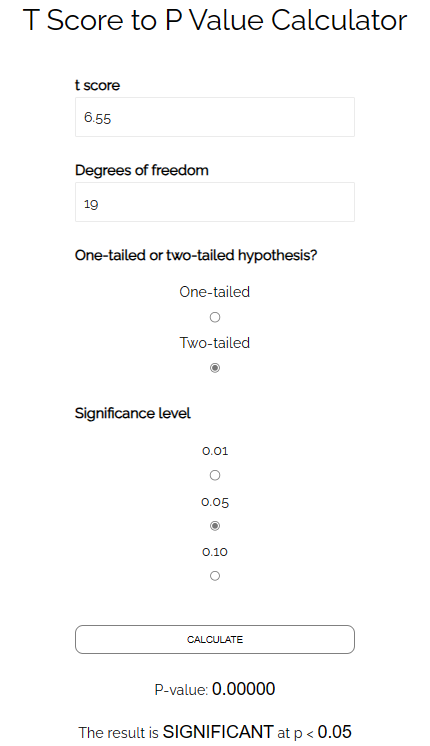
Here School C has a significant improvement many students exceeded the state average test score.. But how significant is improvement? The statistics has a standard practice of computing probabilities associated with null hypothesis designated by p-value. Upon application of statistical computation, it turns out that School C did a p value of 0.0000, an increase of 19 points compared to state average score of 232. According to NAEP scaling score AZ students from School C are proficient in their mathematics skills.
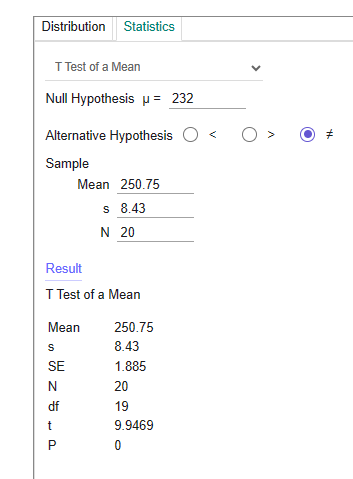

Here School D has a very significant improvement many students exceeded the state average test score.. But how significant is improvement? The statistics has a standard practice of computing probabilities associated with null hypothesis designated by p-value. Upon application of statistical computation, it turns out that School D did a p value of 0.0000, an increase of 62 points compared to state average score of 232. According to NAEP scaling score AZ students from School D are all advanced in their mathematics skills.


Important thing to remember notice school B, school C, and school D all of them have reported p=0.0000. How will you compare which school did perform better using t-test information only? By using t-test score, you can compare which school perform better. School D has the highest t-test score of 32.9177 therefore school D is the best performer.
 Go to page 25 of 140
 Go to page 24 of 140
Strong — aligned with the stated claim
Poor — serious construct drift
Very poor — unstable but identifiable construct
Incoherent — no stable pooled referent
Ambiguous — unclear or undefined
test scores
homework quality
perceptions of learning
critical thinking
motivation
self-efficacy
attitudes
engagement
creativity
anxiety
These are not interchangeable, even if labeled “learning outcomes” or “academic achievement.” Calling a construct “multidimensional” does not make its dimensions poolable. Pooling unlike outcomes produces an effect size with no stable substantive meaning.
teacher actions
student actions
cognitive processes
sequencing
scaffolding
learning targets
They are infinitely variable across contexts. A tool has no inherent instructional method; its use depends entirely on human design choices.
defined steps
defined roles
defined cognitive demands
defined mechanisms of learning
Tools provide none of these. They can be used for tutoring, feedback, inquiry, assessment, writing support, or simple search — each activating different learning processes. Pooling these uses as one “intervention” produces conceptual incoherence.
IV incoherence — the “intervention” is not a unified construct
DV incoherence — outcomes are pooled without conceptual alignment
Effect-size collapse — statistical averages with no interpretable meaning
This is the foundational flaw in many AI-in-education meta-analyses.
Copyright 2026
Never Forget Again with IN-V-BAT-AI
INVenting Brain
Assistant Tools
using Artificial Intelligence
(IN-V-BAT-AI)
Established 2009
Unique visitors as of 10/7/2026 = 257,407
from 150 countries
Unique visitors as of 10/7/2026 = 257,407
from 150 countries