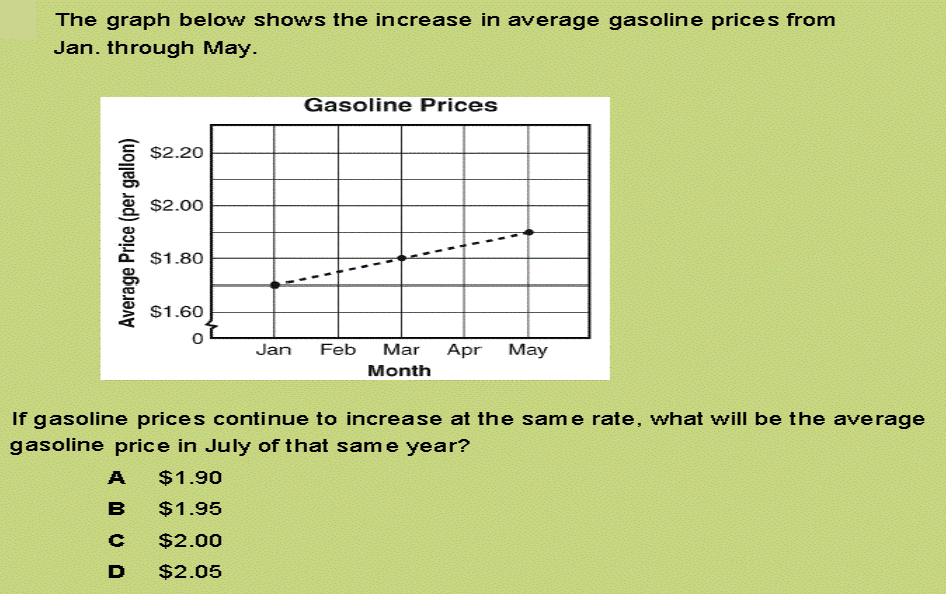
The graph below shows the increase in average gasoline prices from Jan. through May. If the gasoline prices continue to increase at the same rate, what will be the average gasoline price in July of that same year? The graph below shows the increase in average gasoline prices from Jan. through May. If the gasoline prices continue to increase at the same rate, what will be the average gasoline price in July of that same year? advertisement
Look at the graph. Which situation is best represented by the graph? Click here to see the graph. Look at the graph. Which situation is best reprsented by the graph? Click here to see the graph. advertisement
The graph below shows the percent of the moon’s face illuminated for the month of April. On What day in April did the moon reach its maximum illumination? The graph below shows the percent of the moon’s face illuminated for the month of April. On What day in April did the moon reach its maximum illumination? advertisement
The table below shows the percentage of the most popular colors of sports cars made during 2002. Which component causes the data to seem distorted? The table below shows the percentage of the most popular colors of sports cars made during 2002. Which component causes the data to seem distorted? advertisement
Which of the graphs below contains a line of best fit that best represents the data? Which of the graphs below contains a line of best fit that best represents the data? advertisement
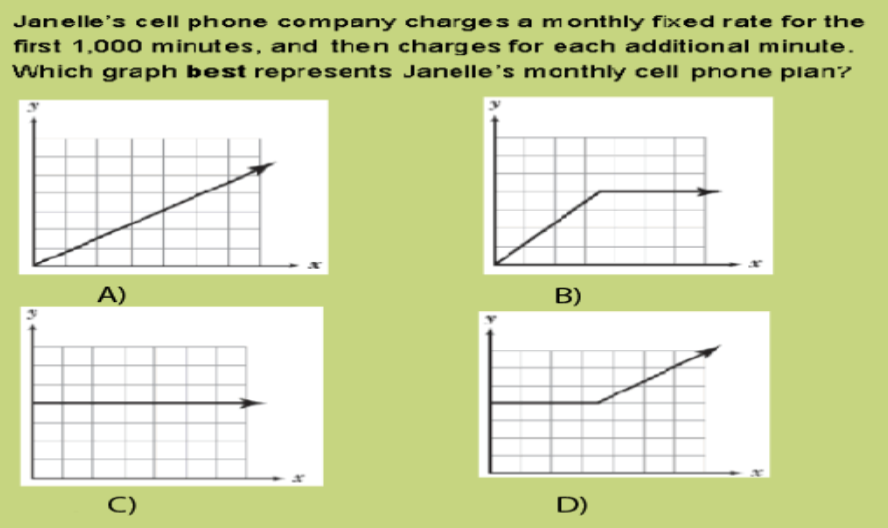
Janelle’s cell phone company charges a monthly fixed rate for the first 1,000 minutes, and then charges for each additional minute. Which graph best represents Janelle’s monthly cell phone plan? Janelle’s cell phone company charges a monthly fixed rate for the first 1,000 minutes, and then charges for each additional minute. Which graph best represents Janelle’s monthly cell phone plan? advertisement
The graph below shows the increase in average gasoline prices from January through May. If the gasoline prices continue to increase at the same rate, what will be the average gasoline price in July of that same year? A. -3 B. -4 C. -6 D. -7 The graph below shows the increase in average gasoline prices from January through May. If the gasoline prices continue to increase at the same rate, what will be the average gasoline price in July of that same year? advertisement
Which situation is best represented by the graph? Which situation is best represented by the graph? advertisement