Sheri asks 83 students at school to choose the sports that they most enjoy watching. The students can choose from baseball, basketball, football, and soccer. The results are shown in the table. Click to see the table. Sheri asks 83 students at school to choose the sports that they most enjoy watching. The students can choose from baseball, basketball, football, and soccer. The results are shown in the table. Click to see the table. advertisement
Look at the graph. Which situation is best represented by the graph? Click here to see the graph. Look at the graph. Which situation is best reprsented by the graph? Click here to see the graph. advertisement
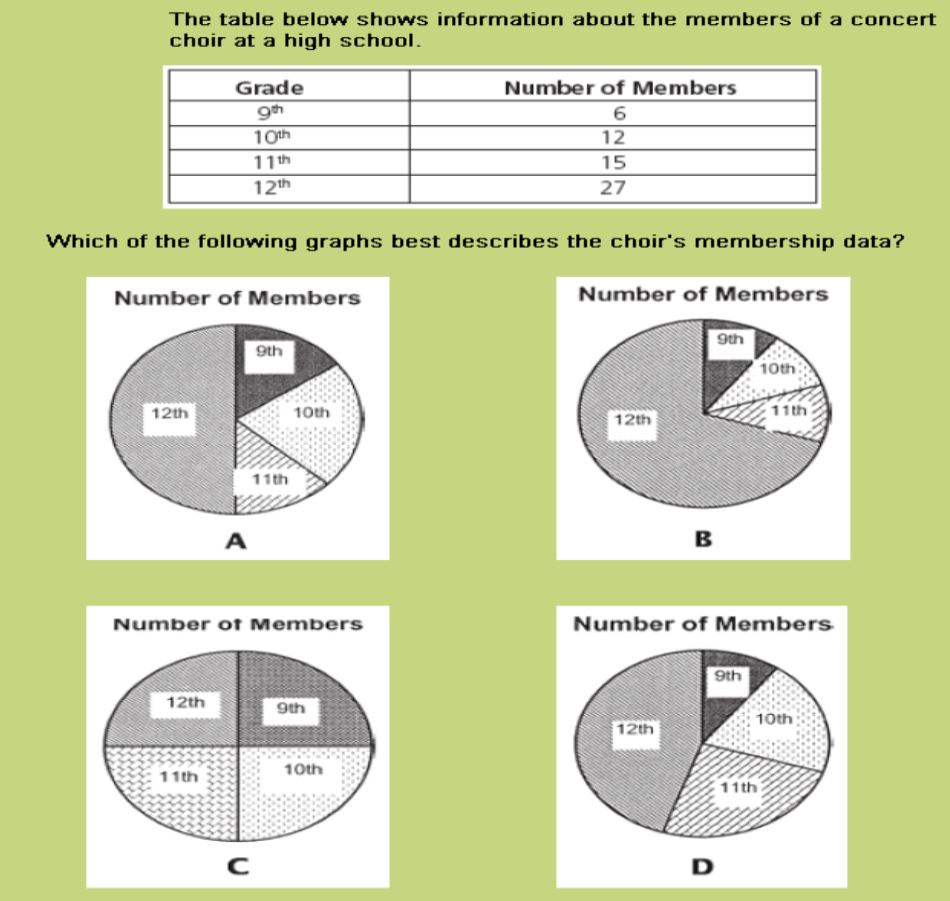
The table below shows information about the members of a concert choir at a high school. Which of the following graphs best describes the choir’s membership data? The table below shows information about the members of a concert choir at a high school. Which of the following graphs best describes the choir’s membership data? advertisement
Which equation represents the data in the table? Which equation represents the data in the table? advertisement
Janelle’s cell phone company charges a monthly fixed rate for the first 1,000 minutes, and then charges for each additional minute. Which graph best represents Janelle’s monthly cell phone plan? Janelle’s cell phone company charges a monthly fixed rate for the first 1,000 minutes, and then charges for each additional minute. Which graph best represents Janelle’s monthly cell phone plan? advertisement
Which table of values can be used to graph the equation below? Which table of values can be used to graph the equation below? advertisement