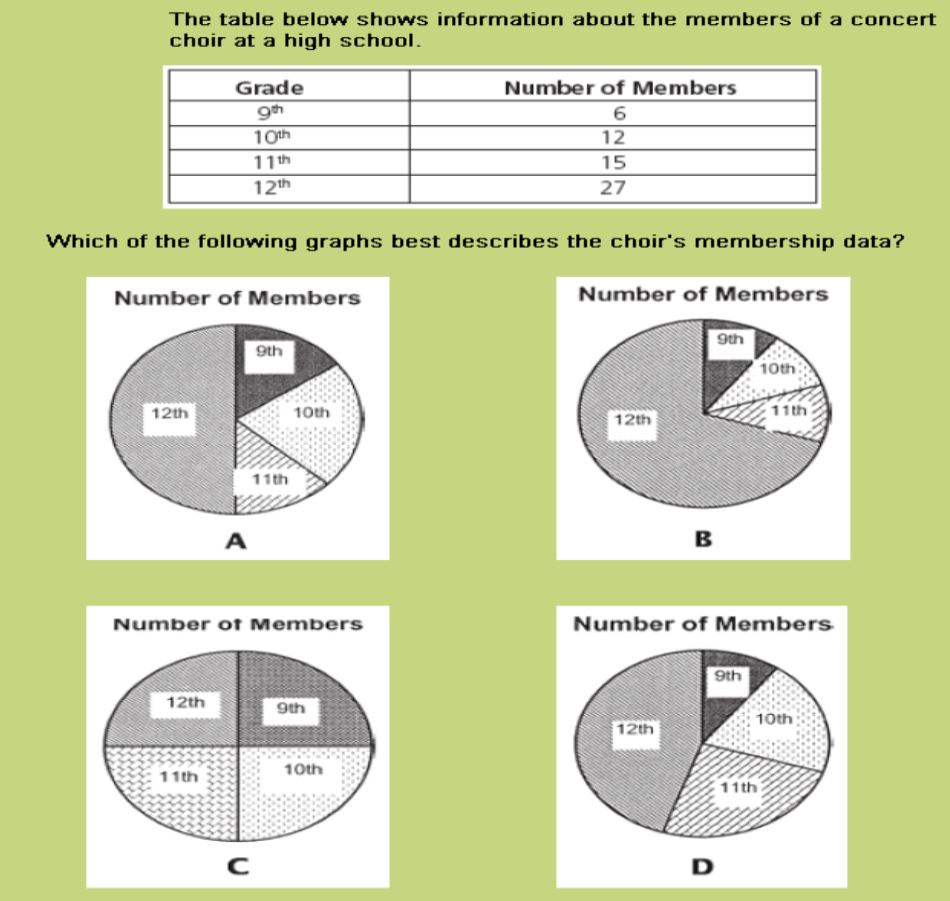
The table below shows information about the members of a concert choir at a high school. Which of the following graphs best describes the choir’s membership data?

advertisement
INVBAT.COM – A.I. + VOICE – AUGMENTED INTELLIGENCE SERVICE PROVIDER
NEVER FORGET NOW POSSIBLE IF YOU HAVE A PERSONAL A.I. MEMORY ASSISTANT