Look at the table of values. Which equation represents the relationship between x and y? Look at the table of values. Which equation represents the relationship between x and y?
For which of the following would the use of a table of values not be helpful? For which of the following would the use of a table of values not be helpful? advertisement
Look at the table of values. Click to see the table. Which equation represents the relationship between x and y? Look at the table of values. Click to see the table. Which equation represents the relationship between x and y? advertisement
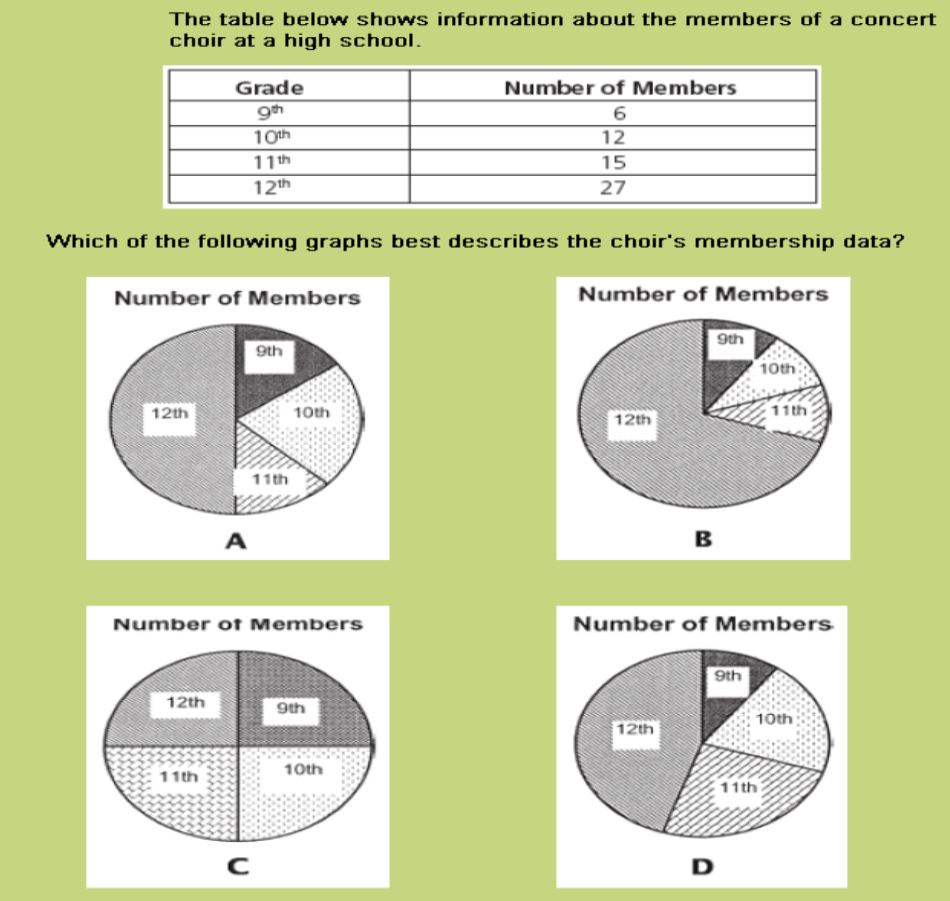
The table below shows information about the members of a concert choir at a high school. Which of the following graphs best describes the choir’s membership data? The table below shows information about the members of a concert choir at a high school. Which of the following graphs best describes the choir’s membership data? advertisement
Which equation represents the data in the table? Which equation represents the data in the table? advertisement
Which table of values can be used to graph the equation below? Which table of values can be used to graph the equation below? advertisement
For which of the following would the use of a table of values not be helpful? A. Determine the results of a probability experiment. B. Find the 10th term in the number pattern 2, 5, 7, 12, … C. Find the area of a trapezoid with the dimensions b1=10, b2=15, h=4. D. Determine the mean number of books checked out from a library per day for 30 days For which of the following would the use of a table of values not be helpful? A. Determine the results of a probability experiment. B. Find the 10th term in the number pattern 2, 5, 7, 12, … C. Find the area of a trapezoid with the dimensions b1=10, b2=15, h=4. D. Determine the mean number of books checked out from a library per day for 30 days advertisement