Look at the table of values. Which equation represents the relationship between x and y? Look at the table of values. Which equation represents the relationship between x and y?
Look at the table of values. Click to see the table. Which equation represents the relationship between x and y? Look at the table of values. Click to see the table. Which equation represents the relationship between x and y? advertisement
Sheri asks 83 students at school to choose the sports that they most enjoy watching. The students can choose from baseball, basketball, football, and soccer. The results are shown in the table. Click to see the table. Sheri asks 83 students at school to choose the sports that they most enjoy watching. The students can choose from baseball, basketball, football, and soccer. The results are shown in the table. Click to see the table. advertisement
The table shows a relationship between the number of sets of dishes and the number of plates in the sets. How many plates are in 1 set of dishes? The table shows a relationship between the number of sets of dishes and the number of plates in the sets. advertisement
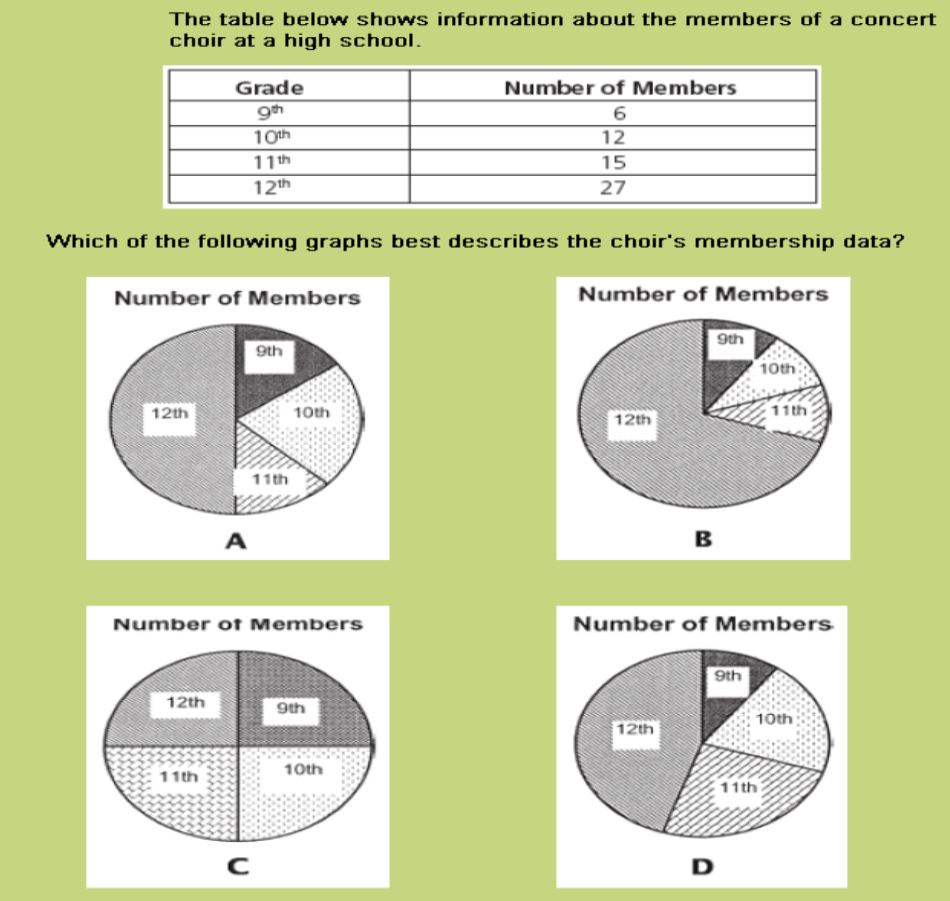
The table below shows information about the members of a concert choir at a high school. Which of the following graphs best describes the choir’s membership data? The table below shows information about the members of a concert choir at a high school. Which of the following graphs best describes the choir’s membership data? advertisement
Which equation represents the data in the table? Which equation represents the data in the table? advertisement
Which table represents y as a function of x ? Which table represents y as a function of x ? advertisement