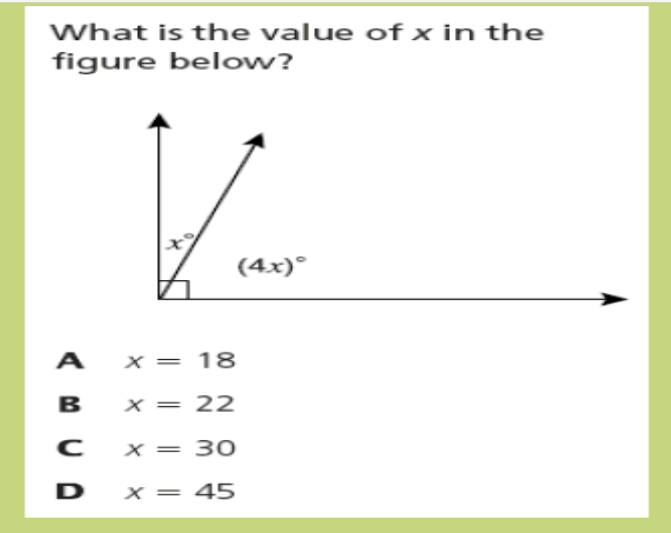
What is the value of x in the figure below? What is the value of x in the figure below? advertisement
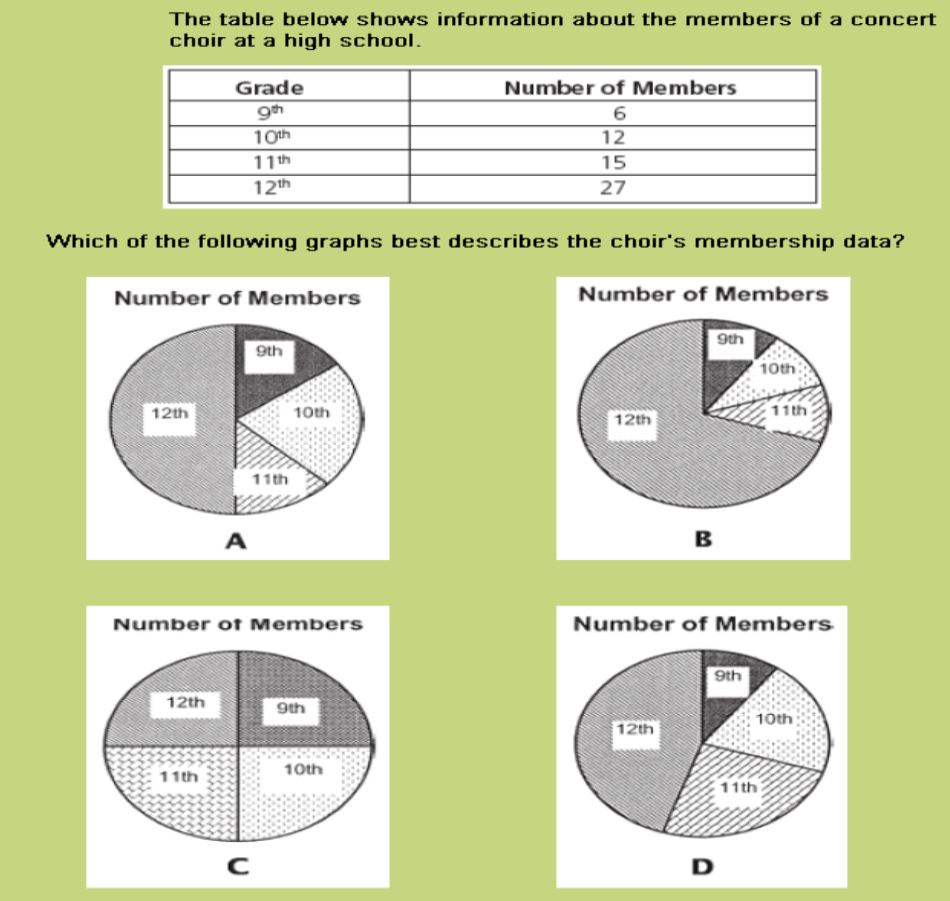
The table below shows information about the members of a concert choir at a high school. Which of the following graphs best describes the choir’s membership data? The table below shows information about the members of a concert choir at a high school. Which of the following graphs best describes the choir’s membership data? advertisement
Jan proved that the two triangles below are congruent. Which postulate did Jan use for her proof? Jan proved that the two triangles below are congruent. Which postulate did Jan use for her proof? advertisement
Which of the following does not show a close approximation? Which of the following does not show a close approximation? advertisement
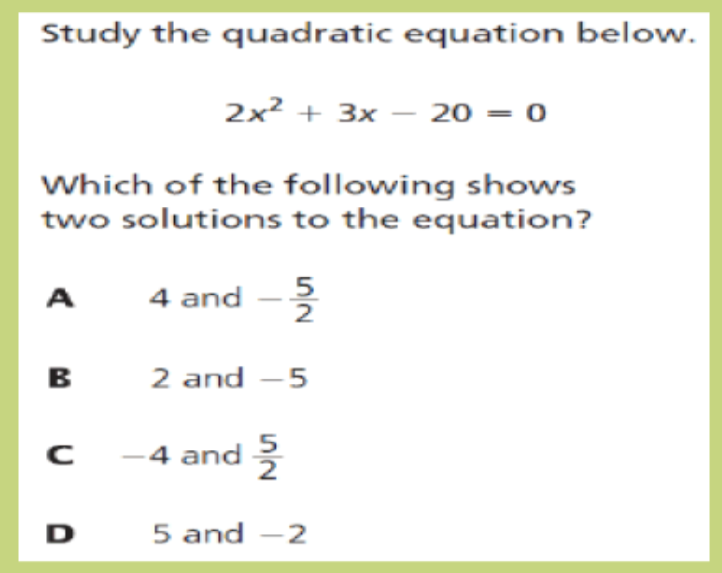
Study the quadratic equation below. 2x2 + 3x – 20 = 0 Which of the following shows two solutions to the equaton? Study the quadratic equation below. 2x2 + 3x – 20 = 0 Which of the following shows two solutions to the equaton? advertisement
A teacher must select 2 students from a list of 4 students. How many distinct group of 2 students are possible? A teacher must select 2 students from a list of 4 students. How many distinct group of 2 students are possible? advertisement
Study the proportion below. What value of x makes the proportion true? Study the proportion below. What value of x makes the proportion true? advertisement
The stem-and-leaf plot below shows test scores for 25 students. Which box-and-whisker plot correctly displays the data in the stem-and-leaf plot? The stem-and-leaf plot below shows test scores for 25 students. Which box-and-whisker plot correctly displays the data in the stem-and-leaf plot? advertisement
Three transformations will be performed on triangle ABC. Which set of transformations will always produce a congruent triangle? Three transformations will be performed on triangle ABC. Which set of transformations will always produce a congruent triangle? advertisement
What is the apparent solution to the system of equations graphed below? What is the apparent solution to the system of equations graphed below? advertisement